
Languages:

Map of observed human vulnerability based on national averages.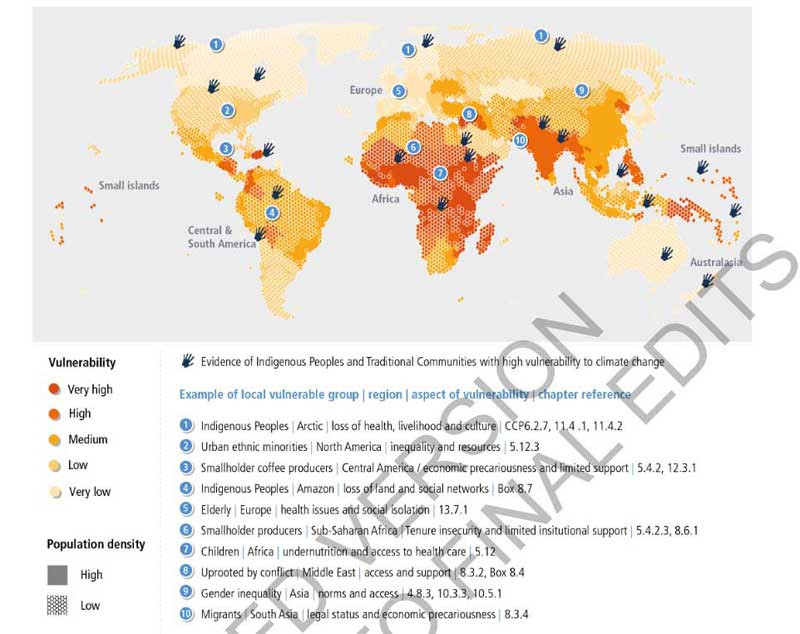 This maps does not show local differences in vulnerability, below the map are examples of some local vulnerable populations and vulnerable Indigenous Peoples and Traditional Communities are highlightes Source: IPCC
Climate Change 2022: Impacts, Adaptation and Vulnerability Related publication:
Other Figures & Tables on this publication: Urban infrastructure failures cascade risk and loss across and beyond the city Map of observed human vulnerability based on national averages. Cascading impacts of climate hazards on food and nutrition Compound risks in coastal and island systems Climate change and human health and wellbeing: Risks and responses Panel A - Interactions across the eight Representative Key Risk level Scheme describing the process applied to define a confidence level |

