Fisheries
1. What is the overall fisheries production?
- 1.1 How much is being fished?
- 1.2 How much is being fished in the world's oceans and seas?
- 1.3 What is the trend in open ocean catches?
- 1.4 How much is being fished in inland waters?
- 1.5 How much is produced by aquaculture?
The source document for this Digest states:
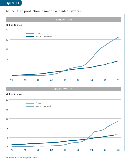
Global production from capture fisheries and aquaculture supplied about 101 million tonnes of food fish in 2002, providing an apparent per capita supply of 16.2 kg (live weight equivalent), with aquaculture accounting for the growth in per capita supply since 2000 (Tables 1 and 2 and Figures 1 and 2)."Outside China, the world’s population has been increasing more quickly than the total food fish supply; as a result the average per capita fish supply outside China declined from 14.6 kg in 1987 to 13.2 kg in 1992 and has since remained stable (Figure 2). Overall, fish provided more than 2.6 billion people with at least 20 percent of their average per capita animal protein intake. The share of fish proteins in total world animal protein supplies grew from 14.9 percent in 1992 to a peak of 16.0 percent in 1996 and remained close to that level (15.9 percent) in 2001.
Table 1: World Fisheries production and utilization
Table 2: Fisheries Production and utilization: world excluding China
Figure 1:World capture and aquaculture production
Figure 2:Utilization and supply, excluding China Preliminary estimates for 2003 based on reporting by some major fishing countries indicate that total world fishery production decreased slightly (-1 percent) compared with 2002. However, the total amount of fish available for human consumption increased to 103 million tonnes and, on average, the per capita supply was maintained. The decrease in capture fisheries resulting from the contraction of reduction fisheries in some major fishmeal-producing countries was partly compensated for by increases in other food fisheries and aquaculture.
China remains by far the largest producer, with reported fisheries production of 44.3 million tonnes in 2002 (16.6 and 27.7 million tonnes from capture fisheries and aquaculture, respectively), providing an estimated domestic food supply of 27.7 kg per capita as well as production for export and non-food purposes. However, there are continued indications that capture fisheries and aquaculture production statistics for China may be too high, as indicated in The State of World Fisheries and Aquaculture 2002,1 and that this problem has existed since the early 1990s. Because of the importance of China and the uncertainty about its production statistics, China, as in previous issues of this report, is generally discussed separately from the rest of the world.
Source & ©: FAO "The State of World Fisheries and Aquaculture, 2004"
Part 1: World review of fisheries and aquaculture, Overview![]()
1.1 How much is being fished?
The source document for this Digest states:
In 2002, total capture fisheries production amounted to 93.2 million tonnes, slightly (0.3 million tonnes) above production in 2001 (Table 1
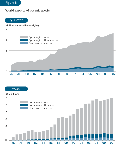
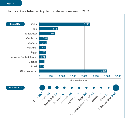
). The first sale value of this catch amounted to around US$78 billion, representing a 1.6 percent decline compared with the value in 2000, partly caused by a decrease of catch and a decline of the unit value of landings for food consumption. Within the total value, reduction fisheries accounted for nearly US$3 billion. Global catches (Figure 3 ) remained stable during the last four years for which complete statistics are available (1999–2002), with the exception of 2000 when annual catches exceeded by over 2 million tonnes the level of preceding and subsequent years, a consequence of the remarkable increase in the environmentally driven recovery of stocks of Peruvian anchoveta. Preliminary estimates indicate that global marine catches decreased in 2003 by about 3 million tonnes compared with 2002. This decrease roughly corresponds to the drop in catches of Peruvian anchoveta and other reduction species in the Southeast Pacific. The top ten capture fishery producing countries have not changed since 1992. In 2002, their cumulative catches represented 60 percent of the world total, with China and Peru still leading the ranking in both 2001 and 2002 (Figure 4
). Capture production reported by China has remained fairly stable since 1998 (Figure 3 ), while trends in Peruvian total capture production are always strongly influenced by variations in anchoveta catches.
Source & ©: FAO "The State of World Fisheries and Aquaculture, 2004"
Part 1: World review of fisheries and aquaculture, Capture fisheries production![]()
1.2 How much is being fished in the world's oceans and seas?
The source document for this Digest states:
Marine capture fisheries production in 2002 was 84.5 million tonnes, representing a decline of 2.6 percent with respect to 2000 and a minor increase of 0.4 percent in comparison with 2001 catches.
During the past decade, the reported landings of marine capture fisheries have fluctuated between 80 and 86 million tonnes (average 1993–2003, 84 million tonnes), a slight increase over the preceding decade (average, 77 million tonnes). It should be noted that, between the two periods, the quantity of marine fish caught and discarded has fallen by several million tonnes (see the section on discards in marine capture fisheries). This came about, inter alia, through improved gear selectivity and fishing practices (that reduced bycatch), fisheries management that decreased access to some stocks (by reducing allowable catches and including the closure of some fisheries), no-discard policies in some countries (that forced landings of all catches) and growing demand for fish combined with improved technologies and opportunities for utilizing bycatch. Despite the uncertainty regarding the total decrease in discards and the proportion of that decrease resulting from improved fisheries management, increased demand and improved processing, respectively, there is no doubt that marine capture fisheries are moving towards a more appropriate use of wild fish stocks.
Figure 5:Principal marine fishing areas The Northwest and Southeast Pacific are still the most productive marine fishing areas (Figure 5
), although total catches in these two areas decreased by 1.8 and 2.0 million tonnes in 2002 compared with 2000 levels. Catches also decreased substantially from 2000 levels in the Eastern Central and Southwest Atlantic. In the former area, catches had increased in 2001 but decreased by more than 0.5 million tonnes in 2002, largely as a result of reduced small pelagic and cephalopod catches. In the Southwest Atlantic, cephalopod catches have declined even more dramatically, from 1.2 million tonnes in 1999 to 0.54 million tonnes in 2002. By contrast, catches were still growing in fishing areas that mostly lie in the tropical regions of the Indian and Pacific Oceans, where catches of large (mainly tuna) and small pelagic species continued to increase. Among the main fishing areas in temperate waters, total catches in the Northeast Atlantic and Mediterranean did not show significant variations, while in the Northwest Atlantic and in the Northeast Pacific, total catches increased in 2001 and remained stable in 2002.
Figure 6:Marine capture fisheries: Top ten species After the high catches of 2000 (the third highest ever at 11.3 million tonnes), anchoveta decreased to 7.2 million tonnes in 2001 and recovered to 9.7 million tonnes in 2002, ranking once again as the most caught marine species (Figure 6
). Other major Clupeoid species (e.g. Atlantic herring, Japanese anchovy and European pilchard/sardine) did not show a common catch trend in the latest years, as species belonging to this group are strongly influenced by the variability of local environmental conditions. Overall catches of the Gadiformes group of species (e.g. cods, hakes and haddocks) continued to decrease and by 2002 had reached their lowest levels since 1967. The value of these catches for food uses amounted to US$5.7 billion, representing 8 percent of the total value of landings for consumption. Alaska pollock and blue whiting, the two major species in terms of catches, but of low commercial value, also decreased in 2002 following a significant increase in 2001. After minor decreases in 2000 and 2001, total catches of tuna and tuna-like species exceeded 6 million tonnes for the first time in 2002, accounting for 11 percent of the total value of landings for consumption. Increased catches were also realized from tropical species such as skipjack (the third global species in 2002) and yellowfin tunas. Geographically, catches increased in the two central Pacific fishing areas and the Western Indian Ocean, while in the other fishing areas tuna catches were stable (e.g. the Eastern Indian Ocean) or decreasing (e.g. the Northwest and Southeast Pacific). Total catches of the three major small pelagic species (capelin, Chilean jack mackerel and chub mackerel) increased in 2001 by 33.2 percent in comparison with 2000 but decreased in 2002 by 13.5 percent from 2001 levels.
Catches of oceanic species occurring principally in high seas waters continued to increase (see Box 1 [Question 1.3]).
Catches of the “sharks, rays, chimaeras” group have been stable since 1996 at about 0.8 million tonnes. However, a possible reduction of shark catches may be masked by the remarkable recent improvement in the species breakdown of reported catches (previously mostly combined under the generic item “Elasmobranchii” or even classified as “Marine fishes not identified”) following the efforts of FAO and RFBs to improve shark statistics. In 1996, the FAO capture database included data for 45 species items in the shark group; this more than doubled to 95 species items in 2002 and now represents more than 7 percent of the total, at 1 347.
Total catch production of both marine crustaceans and molluscs declined slightly from their 2000 peak over the following two years. Production trends of cephalopods since the low catches recorded in 1998 have shown marked variation among the three major species: catches of the Eastern Pacific jumbo flying squid rose steeply (2002 catches were 15 times higher than those in 1998); catches of the Western Pacific Japanese flying squid grew markedly in 1999 and 2000 but have been decreasing since; and catches of the Argentine shortfin squid, which in 1999 had reached 1.1 million tonnes in the Southwest Pacific, dropped in the subsequent three years and by 2002 were half of the 1999 maximum.
Source & ©: FAO "The State of World Fisheries and Aquaculture, 2004"
Part 1: World review of fisheries and aquaculture, Capture fisheries production![]()
1.3 What is the trend in open ocean catches?
The source document for this Digest states:
Box 1 Catch and trade of oceanic species
Species items reported in the FAO capture production database were classified as oceanic, further subdivided into epipelagic and deep-water species, or living on the continental shelf.1 A scrutiny of the new species included in the capture database in the latest three updates (2000–2002) showed that 35 more species items (mostly deep-water species) should have been added to those previously selected, reaching a total of 155 oceanic species. This considerable rise in reported deep-water species is probably a result of the growing awareness of deep-water fishing activities that has prompted flag states to improve their monitoring and reporting of deep-water catches, rather than a dramatic increase in deep-water fishing.
In 2002, the share of oceanic catches in global marine catches reached 11 percent. Catches of deep-water species decreased in 2002 after the highest catches ever in 2001, while catches of oceanic tuna decreased in 2000 and 2001 and reached a maximum in 2002 (Figure A
). Catches of other epipelagic species, mainly oceanic squids, have been increasing steeply since a drop in 1998 and also reached a peak in 2002. A significant proportion of the landings of oceanic species enters international marketing channels in various product forms. In 2002, exports of oceanic species accounted for 7 percent of the quantity and of 10 percent of the value of total exports of fish and fishery products. In recent decades, the marked increase in catches of oceanic species was paralleled by a growth in trade of oceanic species, which increased, in terms of live weight equivalent, from 0.6 million tonnes in 1976 to about 3.6 million tonnes in 2002, and in value terms from US$0.5 billion to US$5.9 billion over the same period (Figure B
). Most of these exports consisted of tuna products, also a result of the inadequate identification of other oceanic species in international commodity classifications.
1 For criteria adopted and further reading, see FAO. 2003. Trends in oceanic captures and clustering of large marine ecosystems: two studies based on the FAO capture database, by L. Garibaldi and L. Limongelli. FAO Fisheries Technical Paper No. 435. Rome (available at www.fao.org/DOCREP/005/Y4449E/y4449e03.htm![]()
Source & ©: FAO "The State of World Fisheries and Aquaculture, 2004"
Part 1: World review of fisheries and aquaculture, Capture fisheries production. Box 1![]()
1.4 How much is being fished in inland waters?
The source document for this Digest states:
Total catches from inland waters remained stable at around 8.7 million tonnes in the 2000–02 period. It should be noted, however, that reporting of global inland fisheries production continues to present problems owing to the lack of reliable information on catch quantities and species composition. In many countries, catches by rural communities, who are often the main users of the resource, are not reported in national statistics. Accordingly, the figures on total catch provided here should be considered indicative.
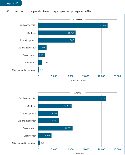
Africa and Asia contributed about 90 percent of global inland capture production in 2002 (Figure 7
). Compared with 2000, catches in 2002 have grown by about 0.6 percent in the Asia inland fishing area, 2 percent in Africa, and 9 percent in South America. Catches decreased in Europe (by 18 percent), North and Central America (by 9.8 percent) and Oceania (by 0.5 percent). The principal ten producers accounted for about 66 percent of global production from inland capture fisheries in 2002 (Figure 8
). China, the top producer, has reported stable inland catches since 1998 and still produces one-quarter of the global inland catches. The Russian Federation and Kenya, which ranked fifth and tenth respectively in 2000, dropped out of the top ten list in 2002 and were superseded by Myanmar and Brazil. The Russian Federation now ranks twelfth following a dramatic decrease in catch during the last two years. The bulk of world production (68.1 percent) came from developing countries other than China and only 6.1 percent from developed countries, classified either as “Economies in transition” or as “Industrialized countries” (Table 3
). The divergence between developed and developing countries in the importance of inland catches is further evidenced by the fact that, in 2002, not one developed country was among the top ten world producers (Figure 8 ). Table 3: Inland capture fisheries production by economic class
Reporting of inland catch by species group remains very poor for many countries and does not permit detailed analysis of trends in catch composition given the unknown portion of catches that may have been reported at higher taxonomic levels or not identified at all. In 2002, about 50 percent of the global inland water catches were reported as “Freshwater fishes not elsewhere included” (Figure 9
).
Figure 9:Inland fisheries: major species groups China accounts for the great majority of reported world catches of freshwater crustaceans (94 percent) and molluscs (87 percent). Compared with 2000 levels, reported catches for 2002 of freshwater crustaceans were higher by about 44 percent, carps and other cyprinids by 3.7 percent and molluscs by 6 percent, while tilapia catches remained stable. Catches of the “shads” group were the highest ever in 2000 but more than halved in 2002.
Source & ©: FAO "The State of World Fisheries and Aquaculture, 2004"
Part 1: World review of fisheries and aquaculture, Capture fisheries production![]()
1.5 How much is produced by aquaculture?
The source document for this Digest states:
According to FAO statistics, the contribution of aquaculture to global supplies of fish, crustaceans and molluscs continues to grow, increasing from 3.9 percent of total production by weight in 1970 to 29.9 percent in 2002. Aquaculture continues to grow more rapidly than all other animal food-producing sectors. Worldwide, the sector has grown at an average rate of 8.9 percent per year since 1970, compared with only 1.2 percent for capture fisheries and 2.8 percent for terrestrial farmed meat-production systems over the same period. Production from aquaculture has greatly outpaced population growth, with the world average per capita supply from aquaculture increasing from 0.7 kg in 1970 to 6.4 kg in 2002, representing an average annual growth rate of 7.2 percent, based largely on China-reported growth.
In 2002, total world aquaculture production (including aquatic plants) was reported to be 51.4 million tonnes by quantity and US$60.0 billion by value. This represents an annual increase of 6.1 percent in quantity and 2.9 percent in value, respectively, over reported figures for 2000. In 2002, countries in Asia accounted for 91.2 percent of the production quantity and 82 percent of the value. Of the world total, China is reported to produce 71.2 percent of the total quantity and 54.7 percent of the total value of aquaculture production.
Table 4
shows the top ten producers of fish, crustaceans and molluscs in 2002, together with the top ten producers in terms of annual growth in aquaculture production in 2000–02. All continents except Europe showed increases in production from 2000 to 2002; in Europe production remained relatively unchanged (0.1 percent annual decrease). World aquatic plant production in 2002 was 11.6 million tonnes (US$6.2 billion), of which 8.8 million tonnes (US$4.4 billion) originated from China, 0.89 million tonnes from the Philippines and 0.56 million tonnes from Japan. Japanese kelp (Laminaria japonica – 4.7 million tonnes) showed the highest production, followed by Nori (Porphyra tenera – 1.3 million tonnes). An additional 4 million tonnes were reported by countries as “Aquatic plants” and not further specified.
Table 4: Top ten producers in aquaculture production: quantity and growth
Table 5: World aquaculture production: rate of growth for different species groups
The rapid growth in production of the different major species groups continues. However, in the period 2000–02 there were indications that the extraordinary growth rates seen in the 1980s and 1990s were slowing slightly (Figure 10
, Table 5 ). Although the growth in production of crustaceans increased in the period 2000–02, growth rates for the other species groups had begun to slow and the overall growth rate, while still substantial, was lower than those experienced over the past 20 years. Aquaculture production in terms of quantity and value for major species groups in 2002 is presented in Figure 11 . The top ten species groups in terms of production quantity and percentage increase in production quantity from 2000 to 2002 are presented in Table 6
. Production of carps and other cyprinids far exceeded that for all other species groups, accounting for nearly 42 percent (16.7 million tonnes) of total production of fish, crustaceans and molluscs. Combined, the top ten species groups accounted for 92.5 percent of the total aquaculture production of fish, crustaceans and molluscs. The largest production for an individual species was the Pacific cupped oyster (Crassostrea gigas – 4.2 million tonnes), followed by three species of carp – the silver carp (Hypophthalmichthys molitrix – 4.1 million tonnes), grass carp (Ctenopharyngodon idellus – 3.6 million tonnes) and common carp (Cyprinus carpio – 3.2 million tonnes). Two high-value species of finfish appear in the top ten species groups in Table 6
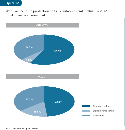
, with the largest percentage increases in production reflecting emerging activities. First, farming of Atlantic cod (Gadus morhua) has begun in Norway and Iceland. Second, the aquaculture of wild-caught tuna by fattening in sea-cages is an increasingly important activity in Mexico, Australia and the Mediterranean region and is now spreading to other areas. According to FAO statistical definitions, the net weight gain in captivity should be attributed to aquaculture, but few countries known to have fattening operations have reported any production from tuna farming as aquaculture. Thus the increase suggested by the official statistics is only a small part of the actual increase in production. Most aquaculture production of fish, crustaceans and molluscs continues to come from the freshwater environment (57.7 percent by quantity and 48.4 percent by value) (Figure 12
). Mariculture contributes 36.5 percent of production and 35.7 percent of the total value. Although brackish-water production represented only 5.8 percent of aquaculture production quantity in 2002, it contributed 15.9 percent of the total value, reflecting the prominence of high-value crustaceans and finfish. Aquaculture production trends for inland and marine waters over the period 1970–2000 are presented in Figure 13 . During this period, reported Chinese inland water aquaculture production increased at an average annual rate of 11.1 percent, compared with 6.9 percent for the rest of the world. Similarly, reported Chinese aquaculture production in marine areas increased at an average annual rate of 10.9 percent compared with 5.5 percent for rest of the world.
Unlike terrestrial farming systems, where the bulk of global production is based on a limited number of animal and plant species, over 220 different farmed aquatic animal and plant species were reported in 2002. On the basis of aquaculture production statistics reported to FAO at the species level, the top ten species account for 69 percent of total production, and the top 25 species for over 90 percent.
It is noteworthy that the growth of aquaculture production of fish, crustaceans and molluscs in developing countries has exceeded the corresponding growth in developed countries, proceeding at an average annual rate of 10.4 percent since 1970. By contrast, aquaculture production in developed countries has been increasing at an average rate of 4.0 percent per year. In developing countries other than China, production has grown at an annual rate of 7.8 percent. In 1970, developing countries accounted for 58.8 percent of production, while in 2002 their share had risen to 90.7 percent. With the exception of marine shrimp, the bulk of aquaculture production in developing countries in 2002 comprised omnivorous/herbivorous fish or filter-feeding species. By contrast, 74 percent of the finfish culture production in developed countries was of carnivorous species.
Source & ©: FAO "The State of World Fisheries and Aquaculture, 2004"
Part 1: World review of fisheries and aquaculture, Aquaculture production![]()


