
Sprachen:

This document is the 2018 annual European Union (EU) emission inventory report under the United Nations Economic Commission for Europe (UNECE) Convention on Long-range Transboundary Air Pollution (LRTAP Convention).
The European Environment Agency (EEA) compiled the report in cooperation with the EU Member States and the European Commission.
It shows that even if there has been great improvements and significant decreases of air emissions in the last decades, air pollution is still a problem in the EU.
This report describes the institutional arrangements and preparation processes behind the EU's emission inventory, including methods and data sources, key category analyses, information on quality assurance and control, general uncertainty evaluation, and information on completeness and underestimations. It includes the emission trends for the European Union (EU) as a whole and for individual Member States, and the contribution of key categories to total emissions and countries that recorded the most important decreases.
Sectorial analyses and emission trends for key pollutants are also described:
| Sector | Sources |
|---|---|
| Energy | Energy balances, EU Emissions Trading Scheme (EU ETS) data, large combustion plant data and large point source (LPS) surveys |
| Transport | Energy balances, vehicle fleet statistics |
| Industry and product use | National production statistics, trade statistics, data from plant operators (facility reports), reporting under the European Pollutant Release and Transfer Register (E-PRTR) and its predecessor, the European Pollutant Emission Register (EPER) |
| Agriculture | National agricultural statitics, specific studies |
| Waste | Landfill databases, national studies, national statistics, information from municipalities |
The Long-range Transboundary Air Pollution (LRTAP) Convention sets atmospheric emission ceilings for the pollutants nitrogen oxides (NOx), non-methane volatile organic compounds (NMVOCs), sulphur oxides (SOx) and ammonia (NH3), to which signatory parties have to comply in addition to the ceilings for individual countries. As amended in 2012, the Protocol specifies new emission reduction commitments in terms of percentage reductions by 2020, relative to base year 2005.
The LRTAP Convention obliges and invites Parties to report emission data for numerous air pollutants:
In line with the revised emission-reporting guidelines of UNECE, parties are also encouraged to report on particulate matter (PM) emitted directly into the air (primary PM). These include PM with a diameter greater than 2.5 microns (PM 2.5, also called fine particulate matter); those with a diameter greater than 10 microns (PM10); black carbon (BC) which is the most strongly light-absorbing component of PM; and total suspended particulates (TSPs).
For the EU, the Gothenburg Protocol (1999) comprising 15 EU Member States set air pollutants emissions commitments for 2010. The Protocol was amended in 2012 to set new emission reduction commitments for 2020. Estonia and Malta do not have Gothenburg Protocol ceilings as they are not yet Parties to the Protocol, and Austria, Greece, Ireland, Italy and Poland have signed, but not yet ratified the Gothenburg Protocol.
For NOx, NMVOCs, SOx and NH3, emissions in 2016 were below the Gothenburg Protocol ceilings in all Member States. Three Parties exceeded their NH3 ceilings (Croatia, Germany and Spain), and one Member State (Hungary) exceeded its limit for NMVOCs.
The countries member of the European Economic Area (EEA) Iceland and Turkey have not yet signed the Gothenburg Protocol. In the meantime, the Protocol also specified emission ceilings for three non-EU EEA member countries: Liechtenstein, Norway and Switzerland. Liechtenstein has signed but not yet ratified the protocol.
Data from the above-mentioned countries show that, although Norway exceeded its NOx ceiling from 2010 to 2014, it complied in 2015 and 2016, while it exceeded its NH3 emission ceiling in all years, and that Switzerland complied with all ceilings for all pollutants.
In the EU, a total of 55 different emission inventory source categories were identified as being key categories for at least one pollutant. A number of emission categories were identified as being key categories for more than one of the 14 pollutants assessed.
| Name of key category | Number of occurrences as key category |
|---|---|
| Residential: Stationary (combustion) (NFR 1A4bi) | 14 (NOx, NMVOCs, SOx, CO, PM2.5, PM10, Pb, Cd, Hg, PCDD/Fs, B(a)P, total PAHs, HCB, PCBs) |
| Public electricity and heat production (NFR 1A1a) | 10 (NOx, SOx, PM2.5, PM10, Pb, Cd, Hg, PCDD/Fs, HCB, PCBs) |
| Stationary combustion in manufacturing industries and construction: Non-metallic minerals (NFR 1A2f) | 8 (NOx, SOx, CO, PM2.5, PM10, Pb, Cd, Hg) |
| Iron and steel production (NFR 2C1) | 8 (CO, PM2.5, PM10, Pb, Cd, Hg, PCDD/Fs, PCBs) |
| Stationary combustion in manufacturing industries and construction: Iron and steel (NFR 1A2a) | 6 (SOx, CO, Pb, Cd, Hg, PCDD/Fs) |
| Road transport: Passenger cars (NFR 1A3bi) | 6 (NOx, NMVOCs, CO, PM2.5, PM10, Pb) |
| Commercial/institutional: Stationary (NFR 1A4ai) | 6 (NOx, SOx, PM2.5, Pb, Cd, Hg) |
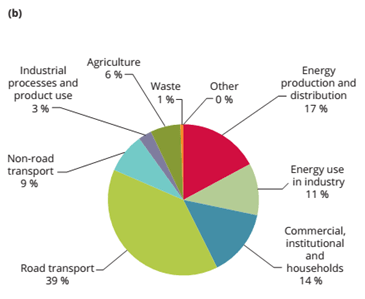
Regarding the share of emissions by sector group and as observed in previous years, each main air pollutant has one major source category: for NOx, this is 'road transport'; for SOx, 'energy production and distribution'; for ammonia (NH3), 'agriculture'; for NMVOCs, 'industrial processes and product use'; and for CO, as well as PM, 'commercial, institutional and households'.
These pollutants harm human health and the environment. Certain species also contribute to the formation of ground-level ozone (O3) and secondary particulate matter (PM) in the atmosphere. Some pollutants have indirect and direct effects on the sunlight absorbed by the Earth and reflected back to space (radiative forcing) and hence on the climate.
Emissions of all pollutants except for copper (Cu) were significantly lower in 2016 than in 1990 (or in 2000 for PM).
With reference to the main air pollutants, sulphur oxide (SOx) was the pollutant type with the greatest reduction in emissions across the EU. SOx emissions were indeed 91 % less in 2016 than in 1990, followed by CO (-69 %), non-methane volatile organic compounds (NMVOCS) (-62 %), NOx (-58 %) and ammonia (NH3)(-23 %).
Between 1990 and 2016, emissions of the main heavy metals (Pb, Cd, Hg), of chlorinated dioxins and furans, total polycyclic hydrocarbons, HCB and PCBs also dropped by at least 65 %.


 in the EU from the five most important key categories")
The reduction in sulphur emissions is the result of a combination of 3 main measures:
Regarding the other main air pollutants emissions, much progress has been made since the early 1990s in reducing point-source emissions of these substances, particularly from industrial facilities. These emissions have been decreasing more slowly over the past decade.
In particular emissions of ammonia have fallen less than emissions of the other main pollutants (23 %) but since 2014 a positive trend has been noticed. The principal key categories for ammonia emissions are animal manure applied to soils', inorganic N-fertilisers and manure management of non-dairy cattle. They jointly make up 52 % of total emissions.
Spain stated that the dramatic drop in SOx emissions in 2008 (63 % lower than in the previous year) was due to the closure of a main brown coal mine in 2007 and the necessary retrofitting in 2008 of the adjacent thermal power plant.
For certain pollutants, not all Member States reported data. Between 2015 and 2016, emissions of NOx and SOx further dropped by 3.7 % and 15.1 %, respectively. CO emissions decreased by 0.6 %, emissions of non-methane volatile organic compounds (NMVOC) decreased by 1.7 %, while ammonia emissions increased by 0.4 %.
By contrast, ammonia emissions increased in 15 Member States with Italy, the United Kingdom and Ireland reporting the highest increases (in order of largest absolute emission increase). Also, copper emissions have increased over the years and were 8 % higher in 2016 than in 1990.
| Arsenic (As) : 67 %, | Benzo(a)pyrene : 19 % |
| Chromium (Cr) : 72 %, | Indeno pyrene (IP) : 65 % |
| Nickel (Ni) : 72 %, | Dioxins & furans : 67 % |
| Selenium (Se) : 34 % | HCB : 95 % |
| Zinc (Zn) : 36 %. | PCB : 74 % |
| Total polycyclic aromatic Hydrocarbons (PAHs) : 83 % | Persistent Organic Pollutants (POPs): clear emissions decreases over the last 25 years which remained broadly stable since 2000. |
The drop in NOx emissions is mainly due to reductions reported by the United Kingdom, Spain, France, Germany and Italy (in order of largest absolute emission reduction). The 'energy production and distribution' sector recorded the largest reductions of NOx (in absolute terms);
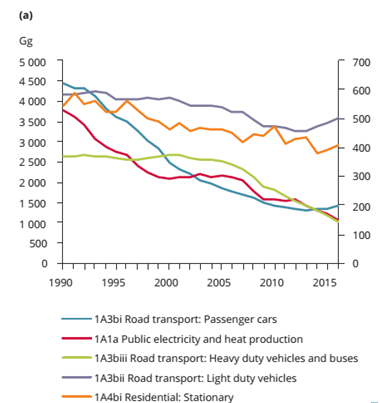
Figure 3.5 NOx emissions in the EU: (a) trend in emissions from the five most important key categories, 1990-2016; (b) share by sector group, 2016; (c) sectoral trends in emissions
NMVOC emissions decreased in 18 Member States, their main emitters being the 'industrial processes and product use' sectors. Greece, the United Kingdom, Italy and the Netherlands (in order of largest absolute emission reduction) were responsible for the highest decreases;
SOx largest reductions in emissions in absolute terms were in Poland, the United Kingdom, Romania and Spain. The sector 'energy production and distribution' contributed most to the reduction of SOx emissions In 2016, the most important decreases (i.e. more than 10 %) to SOx emissions were Poland and Germany;
CO emissions also decreased due to reductions in the 'road transport' mainly in the United Kingdom, Italy and Greece (in order of largest absolute emission reduction).
The 'road transport' sector, primarily through legislative measures requiring the abatement of vehicle exhaust emissions, has significantly reduced its emissions since 1990, emissions of NOx decreasing by 61 %. The road transport sector remains nevertheless a major source of the ground-level ozone precursors NOx, CO and NMVOCs. In 2016 it still contributed respectively to 39 %, 20 % and 9 % to total emissions of these pollutants. The transport sector is also a major source of primary particle matter PM2.5, PM10 and lead emissions. Passenger cars, heavy-duty vehicles and buses are the principal contributors to NOx emissions from this sector; in 2016, passenger cars alone contributed around 70 % of CO emissions from the 'road transport' sector.
Energy- and process-related emissions from industry contribute considerably to the overall emissions of a number of the HMs and POPs. Meanwhile, NOx emissions decreased considerably as a result of certain technical measures, mainly:
This has been achieved partially through improved abatement techniques used in waste water treatment and incinerators and abatement in the metal refining and smelting industries. In some countries, the emissions reduction followed the closure of older industrial facilities due to economic restructuring. Total emissions fell faster between 1990 and 2000 than in the following years.
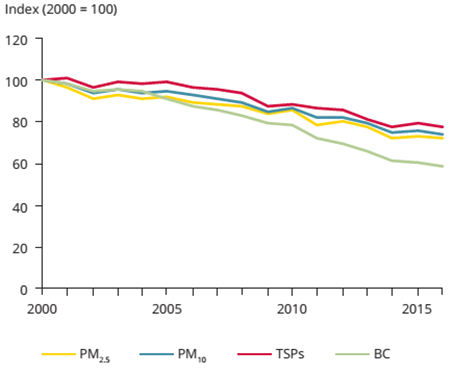
Since 2000, aggregated emissions of total suspended particulates (TSPs) have fallen by 22 % across the EU (and by 54 % since 1990). Since 2000, emissions of primary PM10, PM2.5 and black carbon have fallen by 26 %, 28 % and 41 %, respectively. The 'commercial, institutional and households' sector is the most important source of PM2.5 and PM10.
Total particulate matter (PM) emissions dropped mainly thanks to the introduction or improvement of abatement measures across the 'energy production sector', the 'road transport' and the 'industry' sectors, coupled with other developments, such as switching from fuels containing high amounts of sulphur to those with low amounts.
As SOx, NOx and ammonia play an important role in the formation of secondary PM, the reduction of emissions of these pollutants also influenced the reduction in PM formation.
Reporting has become more complete in recent years. However, a number of data gaps remain in the official data sets received from Member States. The completeness of submissions can therefore be further improved, particularly for historical data for 1990-2000 and for certain pollutants such as heavy metals and POPs. To compile an EU inventory as complete as possible, missing emission data are gap-filled as far as is feasible. Member States are encouraged to consider the findings of the annual quality checks performed by the EEA and its European Topic Centre on Air Pollution and Climate Change Mitigation (ETC/ACM) during the compilation of the EU inventory. In 2018, several Member States were contacted with data requests by the EEA. Ten Member States replied and some gave explanations or announced resubmissions.
The report also contains several recommendations that may further improve the quality of the EU inventory in future. For example, for cases where estimated values are not available, Member States should submit complete inventories and use proper notation keys. They should recalculate emission data for past years when new methods or new scientific knowledge become available.

This summary is free and ad-free, as is all of our content. You can help us remain free and independant as well as to develop new ways to communicate science by becoming a Patron!

